 Thermal Comfort Legend - [source code]
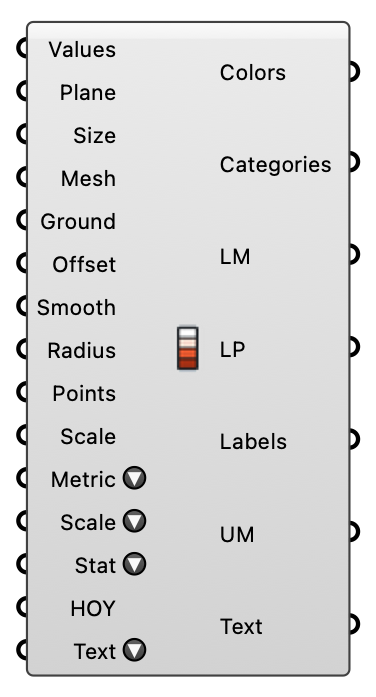
Color UTCI, PET or NOAA Heat Index temperatures by their thermal-stress categories, or a comfort share by its own bands, and create a matching legend.
Input
| Name | Nickname | Description | Type |
|---|---|---|---|
| Values | Either a UTCI Result object (the whole solved year — this component then reduces it per Statistic and HOY, and takes its probe points automatically), or a plain list of values: UTCI, PET or Heat Index temperatures, or a comfort share in percent. For a plain list, set Metric to match — a percentage drawn on the UTCI temperature scale is silently wrong rather than empty. | Generic Data | |
| Plane | Legend base plane. | Plane | |
| Size | Width of each legend color block. | Number | |
| Mesh | Optional mesh to color with the UTCI values. Supports one value per face or per vertex. | Mesh | |
| Ground Surface | Ground | Optional ground geometry used to place the legend at its bottom center. | Geometry |
| Offset | Distance between the bottom edge of the ground bounding box and the legend. | Number | |
| Smooth Colors | Smooth | Use a continuous UTCI color ramp. Face values remain unchanged; vertex-based inputs interpolate naturally across the mesh. When the legend is scaled to actual values (right-click), this blends the ramp instead of quantizing it into discrete bands. | Boolean |
| Circle Radius | Radius | Radius of each colored UTCI sensor disk. | Number |
| Sensor Points | Points | Optional UTCI sensor points. When their count matches UTCI, one colored disk is created per point; the Mesh face/vertex count does not need to match. | Point |
| Scale | Uniform scale factor for the legend bar, label spacing, and centered text. | Number | |
| Metric | Which band scale to draw. UTCI, PET (Temperate), PET (Humid) and Heat Index are temperature scales and accept the Metric Type output of Thermal Comfort directly; Comfort % is the 0-100 comfort share from Deconstruct UTCI. | Text | |
| Color Scale | Scale | Comfort bins: the fixed thermal-stress bands, so colours are comparable between studies. Actual values: the palette spread across this field's own minimum and maximum, with numeric labels — what makes a study that sits inside ONE band readable instead of a single flat colour. | Text |
| Statistic | Stat | Which number to draw when Values is a UTCI Result: Comfort % (the no-thermal-stress share of the selected hours, drawn on the comfort bands) or the Mean, Min or Max UTCI over them (drawn on the UTCI temperature bands). Ignored for a plain list. | Text |
| HOY | Hour(s) of year (1-8760) to reduce a UTCI Result over. Unconnected means the whole year. Ignored for a plain list. | Integer | |
| Legend Text | Text | How the legend is labelled. Viewport: camera-facing text badges drawn by this component, readable at any zoom. Text Objects: the bakeable Centered Labels output. Both: the two together. | Text |
Output
| Name | Nickname | Description | Type |
|---|---|---|---|
| Colors | Color drawn for every input value: the thermal-stress category color, or the ramp color when the legend is scaled to actual values. | Colour | |
| Categories | Thermal-stress category for every UTCI value. | Text | |
| Legend Mesh | LM | Legend bar: one block per thermal-stress category, or a value ramp when scaled to actual values. | Mesh |
| Label Points | LP | Text anchors for the metric title followed by each legend block or tick. | Point |
| Labels | Metric title followed by its ranges and thermal-stress labels, or by its numeric ticks when scaled to actual values. | Text | |
| UTCI Mesh | UM | Colored sensor disks for face-based UTCI data, or a colored mesh for vertex-based data. | Mesh |
| Centered Labels | Text | Centered metric title and thermal-stress label text. | Geometry |