 Vector Field Viewer - [source code]
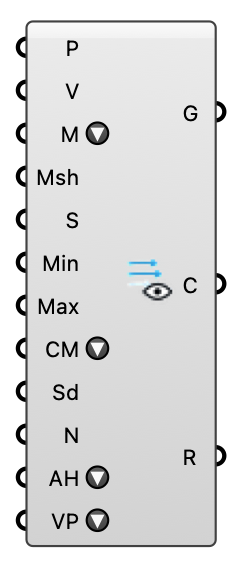
Visualize a probed vector field: colored velocity arrows, a point cloud, a heatmap mesh, streamlines, or volumetric smoke (pick via Display Mode). Feed the Probe component's points + velocity vectors (Field = U), or any points + vectors. For a field without direction — CO2, temperature, age of air, Cp — use the Scalar Field Viewer.
Input
| Name | Nickname | Description | Type |
|---|---|---|---|
| Points | P | Sample points (e.g. the probe points). | Point |
| Velocity | V | Velocity vector per point. | Vector |
| Display Mode | M | How to render the field: Vector Field (arrows), Point Cloud, Heatmap Mesh (colors a supplied mesh), Streamlines, or Volumetric Smoke. | Text |
| Mesh | Msh | Surface to color for Heatmap Mesh mode (colored per vertex from the nearest sample). Ignored in the other modes. | Mesh |
| Scale | S | Arrow length scale (Vector Field mode). | Number |
| Min Speed | Min | Lower end of the color range / filter (m/s). Empty = data minimum. | Number |
| Max Speed | Max | Upper end of the color range / filter (m/s). Empty = data maximum. | Number |
| Color Map | CM | Color ramp for the speed coloring. | Text |
| Seeds | Sd | Streamline seed points (Streamlines mode). Each seed is traced both upstream and downstream, so a seed over a doorway or courtyard shows the full path of the air that passes through it. Empty = automatic seeding on the upwind face of the field bounds, derived from the mean flow direction. | Point |
| Seed Count | N | Maximum automatic seed count when no Seeds are supplied (Streamlines mode). | Integer |
| Arrowhead Scaling | AH | How each arrow's head size follows its point's speed (Vector Field mode): Fixed (constant screen size, speed shows in shaft length only), Linear (head ∝ speed), Square Root (compressed — slow arrows keep visible heads), or Cubic (exaggerated — only the fast flow gets big heads). | Text |
| Vector Plane | VP | Flattens every vector into the horizontal plane (normal +Z), for a plan-view read of the flow: 3D keeps the vectors as they are; Flat XY drops the vertical component, so lengths and colors become HORIZONTAL speed; Flat XY (Keep Speed) lays the vectors flat but rescales each to its original magnitude, so only the direction changes. Flattening feeds the speeds used for coloring and the Range output too, so the legend keeps matching what is drawn. | Text |
Output
| Name | Nickname | Description | Type |
|---|---|---|---|
| Geometry | G | Colored viz geometry for baking: arrow lines, points, or the colored mesh. | Generic Data |
| Colors | C | Color per element (aligned with Geometry). | Colour |
| Range | R | The speed range the colors span (m/s): Min/Max Speed where supplied, otherwise the data minimum/maximum. Feed it to the Wind Legend component for a matching legend, or into a second Vector Field Viewer's Min/Max Speed to color two fields on one scale. | Domain |