 Export to Visualizer - [source code]
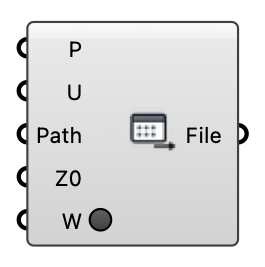
Write probed wind results as a CSV for the Eddy3D Visualizer (https://viz.eddy3d.com/): columns X, Y, Z_relative, U_at_z, mag_U, U_x, U_y, U_z — one row per probe point. Upload the file at https://viz.eddy3d.com/ to view the 3D field, coloured by velocity magnitude, with the vector components powering the viewer's particle-flow overlay.
Input
| Name | Nickname | Description | Type |
|---|---|---|---|
| Points | P | Probe points; their X, Y, Z become the CSV coordinates. | Point |
| Velocity | U | Velocity vector at each point (e.g. the Probe component's U output). Its length becomes mag_U (and U_at_z). Optional — without it the points export with zero magnitude. | Vector |
| File Path | Path | Where the CSV goes: the Wind Study / case object (the file lands in its case folder), a folder, or a full .csv path. Leave File Name empty to auto-name it | Generic Data |
| File Name | Name | File name inside that folder, e.g. "pedestrian" or "pedestrian.csv" (.csv is added when missing). One Export per probe: share the Wind Study, give each its own name. Optional — without it the case name is used. | Text |
| Ground Z | Z0 | Ground height [m] subtracted from each point's Z to give Z_relative. Default 0. | Number |
| Write | W | Write the CSV. Momentary — resets after the file is written. | Boolean |
Output
| Name | Nickname | Description | Type |
|---|---|---|---|
| File | The written CSV path. | Text |