 Design Storm - [source code]
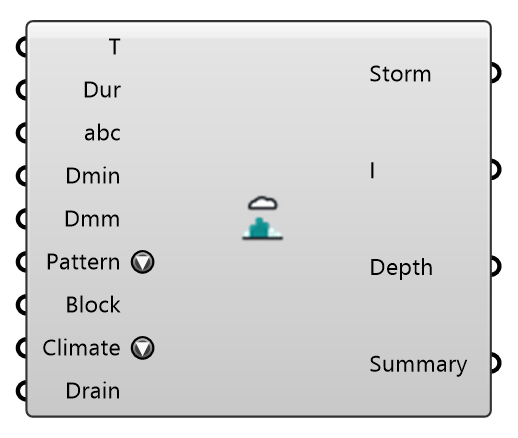
Builds a design-storm hyetograph from an IDF (Intensity-Duration-Frequency) curve, with an optional climate allowance. Feed it to Stormwater Run. Give it EITHER the three coefficients of an i = a/(t+b)^c fit, OR a published depth-duration table (the form NOAA Atlas 14, KOSTRA and FEH actually distribute). The alternating-block and Chicago patterns reproduce the IDF depth at every sub-duration, which is what makes the result a design event rather than a shape. Drainage Depth takes the share the piped drainage carries off the storm before it reaches the surface model: the total depth of the storm the sewers were designed for (2-year, 24-hour in the source study), removed in proportion from every block, after the climate allowance. It is a volume allowance, not a pipe network. Method: Shrestha et al. (2026), Urban Systems Lab, urban-flood-modeling-workflows, https://github.com/UrbanSystemsLab/urban-flood-modeling-workflows.
Input
| Name | Nickname | Description | Type |
|---|---|---|---|
| Return Period | T | Design return period in years — the 1-in-T event. Local guidance sets this; 10, 30, 50 and 100 are the usual choices, with the higher values reserved for infrastructure whose failure matters most. Reported on the result; it does not itself change the rainfall, which comes from the curve you supply. | Number |
| Duration | Dur | Storm duration in MINUTES. Worth sweeping rather than guessing: a small, sealed catchment usually peaks under a short intense burst, a large or absorbent one under a longer storm, and the critical duration is whichever produces the worst result here. | Number |
| IDF Coefficients | abc | Three numbers a, b, c of an intensity fit i = a / (t + b)^c, with t in minutes and i in mm/h. Ignored when a depth-duration table is wired. | Number |
| Durations | Dmin | Durations (minutes) of a published depth-duration table — the form NOAA Atlas 14, KOSTRA and FEH distribute. Pair with Depths; wiring these overrides the coefficients. | Number |
| Depths | Dmm | Total rainfall depths (mm) matching Durations, for the return period being designed against. Interpolated in log-log space so intermediate durations stay on the published curve. | Number |
| Pattern | How the depth is distributed through the storm. Alternating Block (default): peak centred, and every sub-duration matches the IDF curve. Chicago: the same increments arranged around an earlier peak — the harsher test for a design leaning on depression storage. Uniform: constant intensity. Simplest, and understates peak ponding for the same total depth. | Text | |
| Block Length | Block | Length of each hyetograph block in minutes. A real modelling choice, not a discretisation detail: the finer it is, the higher the peak block. 5 minutes is the usual default for urban work. | Number |
| Climate Allowance | Climate | A published percentage uplift on design rainfall. These are ALLOWANCES, not projections — nothing here downscales a climate model — and the source travels onto the Summary output so a report can cite it. Guidance is revised; check a value more than a couple of years old against your own regulator. | Text |
| Drainage Depth | Drain | Total rainfall depth (mm) the piped drainage is assumed to carry off this storm, so it never reaches the surface. Usually the depth of the storm the sewers were designed for, read off the same rainfall statistics (the source study uses the 2-year, 24-hour depth). It comes off after the climate allowance, in proportion from every block: each is scaled by 1 − drainage/total, and a storm no deeper than the drainage reaches the surface as nothing. A volume allowance, not a pipe network — it does not know where the inlets are. 0 (the default) models no drainage. | Number |
Output
| Name | Nickname | Description | Type |
|---|---|---|---|
| Storm | The design storm, for Stormwater Run. | Generic Data | |
| Intensities | I | Rainfall intensity of each block (mm/h), in order. | Number |
| Total Depth | Depth | Total rainfall over the storm (mm) that reaches the surface model — after the drainage allowance, when one is set. | Number |
| Summary | The storm in words, including the climate allowance and its source. | Text |