 LBM Live View - [source code]
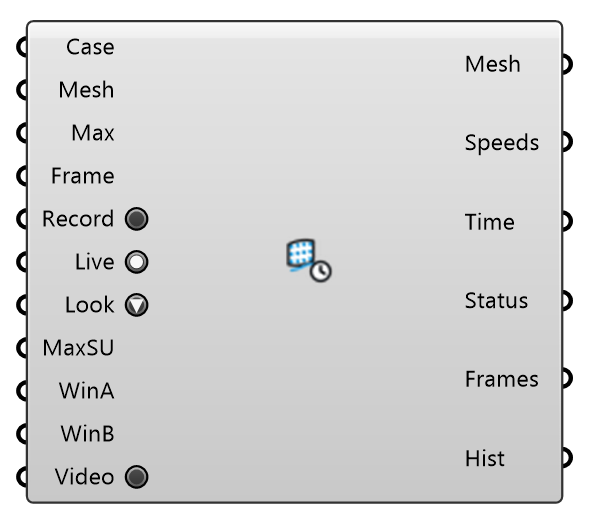
Watch an OpenLB wind solve live in the viewport: colors an analysis mesh with the wind speed of the newest probe snapshot while the solver runs, repainting as each snapshot lands. The solver writes the instantaneous field during warm-up, the running average after, and the final average at the end. Also shows the final field of a completed run. Wire the LBM Run component's Case output into Case, and a mesh lying on the probe layer (the horizontal plane the solver samples: Probe Height on LBM Run Settings, 1.5 m above the ground by default) into Mesh. A vertex is read by interpolating the probes around it; vertices off the layer stay grey. Record keeps every snapshot that lands (results/snapshots/), and Frame plays the recording back: -1 shows the newest snapshot, 0 the first recorded one. Animate a slider on Frame for a replay; Window Start/End show the MEAN over a frame range instead; Video renders every recorded frame through the active viewport into an MP4 (ffmpeg on PATH).
Input
| Name | Nickname | Description | Type |
|---|---|---|---|
| Case | LBM case directory: the 'Case' output of the LBM Run component. | Text | |
| Mesh | Analysis mesh to color, read at its vertices. It must lie on the probe layer: a horizontal plane at pedestrian height covering the area you want to watch. | Mesh | |
| Max Speed | Max | Top of the color scale in m/s. 0 = auto: grows with the largest speed seen this session, so colors stay comparable across snapshots instead of rescaling on every one. | Number |
| Frame | Recorded frame to show (0 = the first recorded snapshot); -1 = the newest snapshot of the run. Beyond the last frame shows the last. | Integer | |
| Record | Keep every snapshot that lands, so the run can be played back with Frame (results/snapshots/). | Boolean | |
| Live | Keep watching the case for new snapshots and repaint as they land. | Boolean | |
| Appearance | Look | What the colours show. Velocity: wind speed in m/s against Max Speed. Speedup: wind speed divided by the case's reference inflow speed at reference height (U_ref from LBM Run's case), against Max Speedup — 1 is the undisturbed wind, above it the flow is accelerated. '+ LIC': the same colours with a line integral convolution of sparse noise over them — thin white strands gliding along the probes' velocity vectors (the mean of a playback window's frames when one is set); a picture of the flow, not a quantity. | Text |
| Max Speedup | MaxSU | Top of the colour scale when Appearance is Speedup (0 = 1.5). | Number |
| Window Start | WinA | First recorded frame of a playback window (0 = the first recorded snapshot); -1 = off. With Window End set too, the mesh shows the MEAN speed over the window instead of a single frame. | Integer |
| Window End | WinB | Last recorded frame of the playback window (inclusive); -1 = off. | Integer |
| Video | Render every recorded frame through the active Rhino viewport into results/video/live-view.mp4 (PNG frames stay beside it). Needs ffmpeg on PATH; the status says where to get it otherwise. | Boolean |
Output
| Name | Nickname | Description | Type |
|---|---|---|---|
| Mesh | The analysis mesh, vertex-colored by wind speed (bake to keep the colors). | Mesh | |
| Speeds | Wind speed per mesh vertex, m/s (aligned with the mesh's vertex order; null off the probe layer). | Number | |
| Time | Simulated time of the displayed snapshot, in seconds (unset when the file carries none). | Number | |
| Status | Snapshot / watcher status. | Text | |
| Frames | Snapshots in the recording. | Integer | |
| Histogram | Hist | Speed histogram of the displayed frame: 20 equal bins over 0-Max Speed, one line per bin, and the share of probed vertices above 5 m/s. | Text |