 Scalar Field Viewer - [source code]
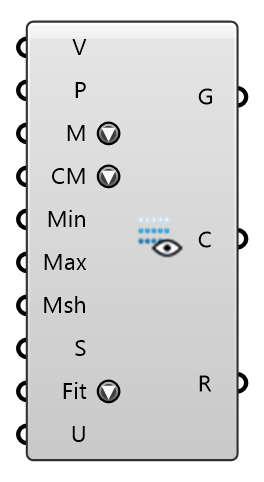
Visualize a probed scalar field — CO2, temperature, age of air, Cp, pressure — as a colored point cloud, a heatmap mesh, or a translucent volumetric cloud. Feed the Probe component's points and one value per point. For velocity, use the Vector Field Viewer.
Input
| Name | Nickname | Description | Type |
|---|---|---|---|
| Values | V | One scalar per point, in whatever unit the field is in — the Probe component's Values output for a single scalar field (CO2, T, age, Cp, p, k). | Number |
| Points | P | Sample points (e.g. the probe points). Empty with a Mesh wired uses the mesh's samples: its vertices when it has one per value (the WRF Probe's Mesh) or its face centres when it has one face per value (the square probe markers of Deconstruct MRT and Deconstruct Wind), in Values order — so mesh-only wiring is complete. | Point |
| Display Mode | M | How to render the field: Point Cloud (colored samples, filtered to the Min/Max band), Heatmap Mesh (colors a supplied mesh from the samples on each face), or Volumetric Cloud (translucent points, more opaque the higher the value — for reading a plume in 3D). | Text |
| Color Map | CM | Color ramp — pick the same map as the Flex Legend so the legend matches what is drawn. | Text |
| Min Value | Min | Lower end of the color range / filter. Empty = data minimum. | Number |
| Max Value | Max | Upper end of the color range / filter. Empty = data maximum. | Number |
| Mesh | Msh | Surface to color for Heatmap Mesh mode. A mesh with faces is subdivided to the samples' spacing and each vertex is read from the samples that lie on its own face, so a wall is not blended from the ground and the roof; faces that meet at a crease keep separate colours. A mesh of bare vertices takes the nearest sample. Ignored in the other modes. | Mesh |
| Size | S | Point Cloud and Volumetric Cloud: drawn point size in pixels. Heatmap Mesh with Fit = Size: the width of each square probe marker, in model units. | Number |
| Fit | Heatmap Mesh over a square-per-probe mesh (Deconstruct MRT / Wind's Mesh): Gapless grows every square to the probe spacing so the squares touch; Size draws each one Size wide. Any other mesh is left as wired. | Text | |
| Units | U | Unit label for the component's readout only (e.g. ppm, K, s, Pa). The field carries no unit of its own, so nothing can infer it: probing CO2 returns a mass fraction, age of air returns seconds, and both are just numbers by the time they reach here. | Text |
Output
| Name | Nickname | Description | Type |
|---|---|---|---|
| Geometry | G | Colored viz geometry for baking: points, or the colored mesh. | Generic Data |
| Colors | C | Color per element (aligned with Geometry). | Colour |
| Range | R | The value range the colors span: Min/Max Value where supplied, otherwise the data minimum/maximum. Feed it to the Flex Legend component for a matching legend, or into a second viewer's Min/Max to put two fields on one comparable scale. | Domain |