 UTCI Time Plot - [source code]
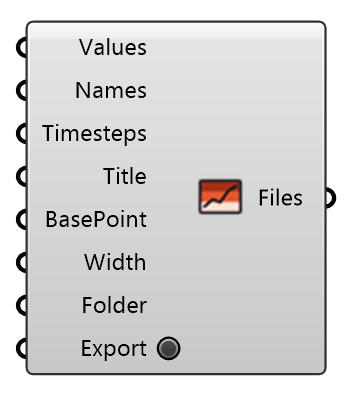
Plots temperature series over time on the UTCI thermal-stress bands — UTCI of one or more design schemes, and any other temperature (MRT, air temperature) on the same axis. One branch per line. Only the stress bands the data reaches are drawn. Export writes SVG, PDF and PNG.
Input
| Name | Nickname | Description | Type |
|---|---|---|---|
| Values | Temperatures in °C, one branch per line and one value per timestep — e.g. one probe's UTCI from Deconstruct UTCI for each design scheme. | Number | |
| Names | One name per branch, for the legend. Defaults to Series 1, 2, … | Text | |
| Timesteps | One label per timestep, for the time axis ("10:00", "Jul 21 14 h"). Defaults to 1, 2, … | Text | |
| Title | Chart title. | Text | |
| Base Point | BasePoint | Lower-left corner of the chart in the viewport. | Point |
| Width | Chart width in model units; the height follows. | Number | |
| Folder | Where Export writes the files. Defaults to ~/Eddy3D/Charts. | Text | |
| Export | Write the chart as SVG, PDF and PNG into Folder. | Boolean |
Output
| Name | Nickname | Description | Type |
|---|---|---|---|
| Files | The SVG, PDF and PNG paths Export wrote. | Text |