 Comfort Hours - [source code]
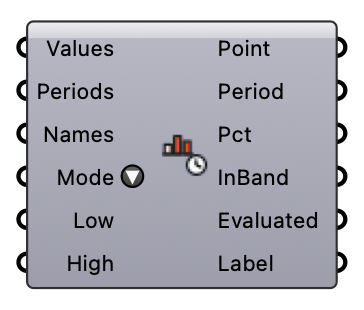
Bin an hourly per-point series (e.g. UTCI) into a comfort range or the UTCI thermal-stress categories, per analysis period, and report hours/percent in each band. Feed it a per-point DataTree (e.g. the UTCI component's output) and, optionally, one Analysis Period per branch (see the Analysis Period / Analysis Period To Hours components); an unwired period covers the whole series as one implicit Annual period.
Input
| Name | Nickname | Description | Type |
|---|---|---|---|
| Values | Hourly per-point series to bin (DataTree, one branch per point, e.g. UTCI 8760h). | Number | |
| Analysis Periods | Periods | Hour-of-year lists (DataTree, one branch per period, 1-based hours). Unwired = one Annual period covering the whole series. | Integer |
| Period Names | Names | Optional label per analysis-period branch, in branch order. Defaults to "Period N" (or "Annual" when Analysis Periods is unwired). | Text |
| Mode | Custom Range bins Low-High; UTCI Categories bins into the 11 UTCI thermal-stress categories instead (Low/High are ignored). | Text | |
| Low | Band lower bound, inclusive. Ignored in UTCI Categories mode. | Number | |
| High | Band upper bound, exclusive. Ignored in UTCI Categories mode. | Number |
Output
| Name | Nickname | Description | Type |
|---|---|---|---|
| Point | Index of the point/probe (0-based, branch order of Values). | Integer | |
| Period | Analysis-period name this row was evaluated over. | Text | |
| % In Band | Pct | Percent of evaluated hours falling in the band/category. | Number |
| Hours In Band | InBand | Count of evaluated hours falling in the band/category. | Integer |
| Hours Evaluated | Evaluated | Count of hours evaluated for this point/period (present, non-NaN samples). | Integer |
| Label | Band label (Custom Range) or UTCI category name (UTCI Categories). | Text |