 Deconstruct SurfaceTemp - [source code]
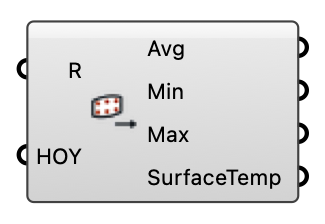
Point-specific statistics (and optionally the raw hours) from a SurfaceTemp Result, without putting the full 8760-hour year on the canvas.
Input
| Name | Nickname | Description | Type |
|---|---|---|---|
| Result | R | Result output of the SurfaceTemp component. | Generic Data |
| HOY | Hour(s) of year (1-8760) to restrict to. Leave unconnected for the whole year. The statistics are reduced over exactly these hours, so a July-afternoon list gives the July-afternoon mean — no re-solve needed. | Integer |
Output
| Name | Nickname | Description | Type |
|---|---|---|---|
| Mean | Avg | Mean surface temperature (°C) per analysis point over the selected hours — the annual average when HOY is unconnected. One value per point, in the SurfaceTemp component's point order. | Number |
| Min | Lowest surface temperature (°C) per analysis point over the selected hours. | Number | |
| Max | Highest surface temperature (°C) per analysis point over the selected hours. | Number | |
| SurfaceTemp | Surface temperature (°C) at each selected hour — one branch per HOY, each holding every point's value {hoy}(point count). Populated ONLY when HOY is connected; with HOY unconnected this would be the entire year, which is the tree this component exists to avoid. Note that a large HOY list is inherently expensive: every value asked for here becomes an object on the canvas. | Number |