 Deconstruct Wind - [source code]
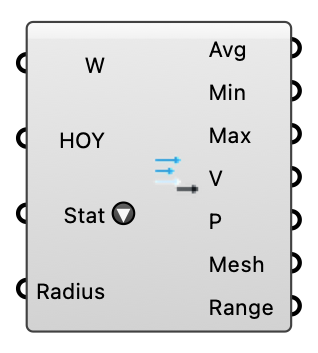
Probe-specific statistics, per-hour values, a colored probe mesh and an inline legend from an annual wind field or Annual VAF object, without putting the full 8760-hour year on the canvas.
Input
| Name | Nickname | Description | Type |
|---|---|---|---|
| Wind Field | W | Annual field object from the VAF component — its Wind Speed output (m/s) or its Annual VAF output (dimensionless factors). One item, probes × hours. | Generic Data |
| HOY | Hour(s) of year (1-8760) to restrict to. Leave unconnected for the whole year. Statistics are reduced over exactly these hours, so a July-afternoon list gives July-afternoon wind — no re-solve needed. | Integer | |
| Statistic | Stat | Value used to color the probe mesh and scale the legend: the Mean, Min or Max of each probe's series over the selected hours. Defaults to Mean. | Text |
| Radius | Half-width of each colored square centered on a probe point. | Number |
Output
| Name | Nickname | Description | Type |
|---|---|---|---|
| Mean | Avg | Mean value per probe over the selected hours — the annual average when HOY is unconnected. | Number |
| Min | Lowest value per probe over the selected hours. | Number | |
| Max | Highest value per probe over the selected hours. | Number | |
| Values | V | The field at each selected hour — one branch per HOY, each holding every probe's value {hoy}(probe count). Populated ONLY when HOY is connected; with HOY unconnected this would be the entire year, which is the tree this component exists to avoid. | Number |
| Points | P | Probe positions carried inside the field (the VAF component's Points input). | Point |
| Mesh | Colored probe mesh for the selected statistic. Requires the field to carry probe positions (wire Points into the VAF component). | Mesh | |
| Range | Minimum and maximum of the selected statistic — the range the Mesh was colored over. Wire it into the Flex Legend component's Range input so the legend labels exactly the scale this mesh uses. | Domain |