 Scalar Field Viewer - [source code]
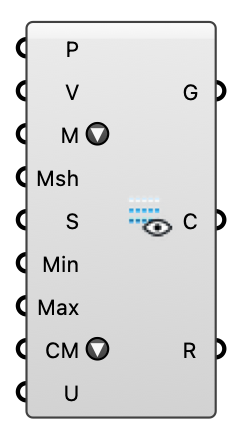
Visualize a probed scalar field — CO2, temperature, age of air, Cp, pressure — as a colored point cloud, a heatmap mesh, or a translucent volumetric cloud. Feed the Probe component's points and one value per point. For velocity, use the Vector Field Viewer.
Input
| Name | Nickname | Description | Type |
|---|---|---|---|
| Points | P | Sample points (e.g. the probe points). Empty with a Mesh wired uses the mesh's vertices — the WRF Probe's Mesh output carries one vertex per sample in Values order, so mesh-only wiring is complete. | Point |
| Values | V | One scalar per point, in whatever unit the field is in — the Probe component's Values output for a single scalar field (CO2, T, age, Cp, p, k). | Number |
| Display Mode | M | How to render the field: Point Cloud (colored samples, filtered to the Min/Max band), Heatmap Mesh (colors a supplied mesh from the nearest sample), or Volumetric Cloud (translucent points, more opaque the higher the value — for reading a plume in 3D). | Text |
| Mesh | Msh | Surface to color for Heatmap Mesh mode (colored per vertex from the nearest sample). Ignored in the other modes. | Mesh |
| Point Size | S | Drawn point size in pixels (Point Cloud and Volumetric Cloud modes). | Number |
| Min Value | Min | Lower end of the color range / filter. Empty = data minimum. | Number |
| Max Value | Max | Upper end of the color range / filter. Empty = data maximum. | Number |
| Color Map | CM | Color ramp — pick the same map as the Flex Legend so the legend matches what is drawn. | Text |
| Units | U | Unit label for the component's readout only (e.g. ppm, K, s, Pa). The field carries no unit of its own, so nothing can infer it: probing CO2 returns a mass fraction, age of air returns seconds, and both are just numbers by the time they reach here. | Text |
Output
| Name | Nickname | Description | Type |
|---|---|---|---|
| Geometry | G | Colored viz geometry for baking: points, or the colored mesh. | Generic Data |
| Colors | C | Color per element (aligned with Geometry). | Colour |
| Range | R | The value range the colors span: Min/Max Value where supplied, otherwise the data minimum/maximum. Feed it to the Flex Legend component for a matching legend, or into a second viewer's Min/Max to put two fields on one comparable scale. | Domain |